AI coding agents have a memory problem. Every new session starts from zero: the agent greps, opens file after file, and rebuilds a picture of your project it already had yesterday. And if you're the human on the project, you often don't have a good picture either, just a folder tree and a README that's a few months out of date.
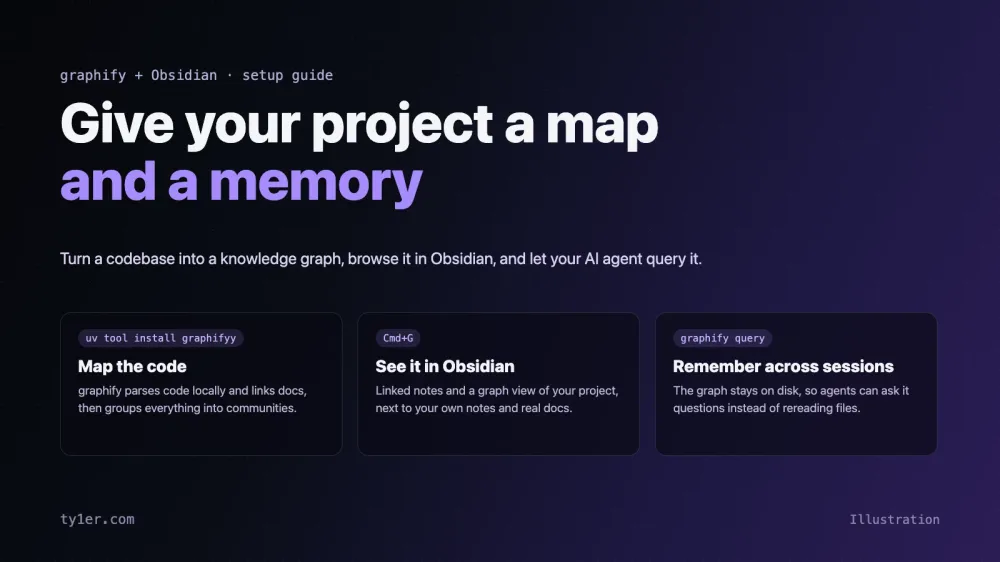
graphify and Obsidian attack both sides of that. graphify turns a codebase, plus its docs, PDFs, and images, into a knowledge graph that's saved to disk and can be queried. Obsidian is a free app for browsing linked Markdown notes, with a graph view that makes the structure visible. Together, they give your project a map you can look at and a memory your agent can ask questions.
This guide covers how to install both, build your first graph, open it in Obsidian, and wire it into Claude Code. I set this up on this site's own Ghost theme repo, so the numbers and lessons below are from a real run. Versions and commands were checked against graphify 0.9.x and Obsidian 1.14.4 in October 2026.
What each tool does
- graphify is an open-source (Apache-2.0) Python tool and AI-assistant skill. It parses code locally with tree-sitter, so no AI model is involved and nothing leaves your machine, and it resolves calls, imports, and inheritance across about 40 languages. Docs, PDFs, and images get a semantic pass from your AI agent or a configured backend. It then groups everything into communities (subsystems), finds the most-connected god nodes, and writes a report, an interactive HTML map, and a queryable
graph.json. Each link is labeled as extracted from the source or inferred, so you can see what's certain and what's a guess. - Obsidian is a note-taking app that works on a plain folder of Markdown files, which it calls a vault. It's free with no sign-up, including for work use (a commercial license is optional). Its graph view, backlinks, and search make any folder of linked notes easy to explore.
Step 1: Install Obsidian
Download it from obsidian.md/download. It's available as a universal .dmg for Mac, an .exe for Windows, and AppImage, Snap, Deb, or a community-maintained Flatpak for Linux. There are also iOS and Android apps. On a Mac with Homebrew:
brew install --cask obsidianThat's it. You don't need an account. Paid extras like Sync ($4–5 per month) and Publish ($8–10 per month) are optional and not needed for anything in this guide.
Step 2: Install graphify
graphify needs Python 3.10 or newer. The project recommends installing it with uv, which keeps it in its own isolated environment:
# install uv if you don't have it (macOS: brew install uv)
curl -LsSf https://astral.sh/uv/install.sh | sh

# install the graphify CLI (note the package name has two y's)
uv tool install graphifyy

# register the /graphify skill with your AI assistant
graphify install
The PyPI package is graphifyy, but the command is graphify. If your shell says graphify: command not found after installing, run uv tool update-shell and open a new terminal. pipx install graphifyy works too.
graphify install sets it up for Claude Code by default. Other assistants use a platform flag, for example graphify install --platform codex or --platform gemini, and Cursor uses graphify cursor install. Add --project to install the skill into just the current repository.
Optional extras add PDF, Office, video transcription, an MCP server, and more, for example uv tool install "graphifyy[pdf,mcp]".
Step 3: Build your first graph
Open your AI assistant in the project folder and run the skill:
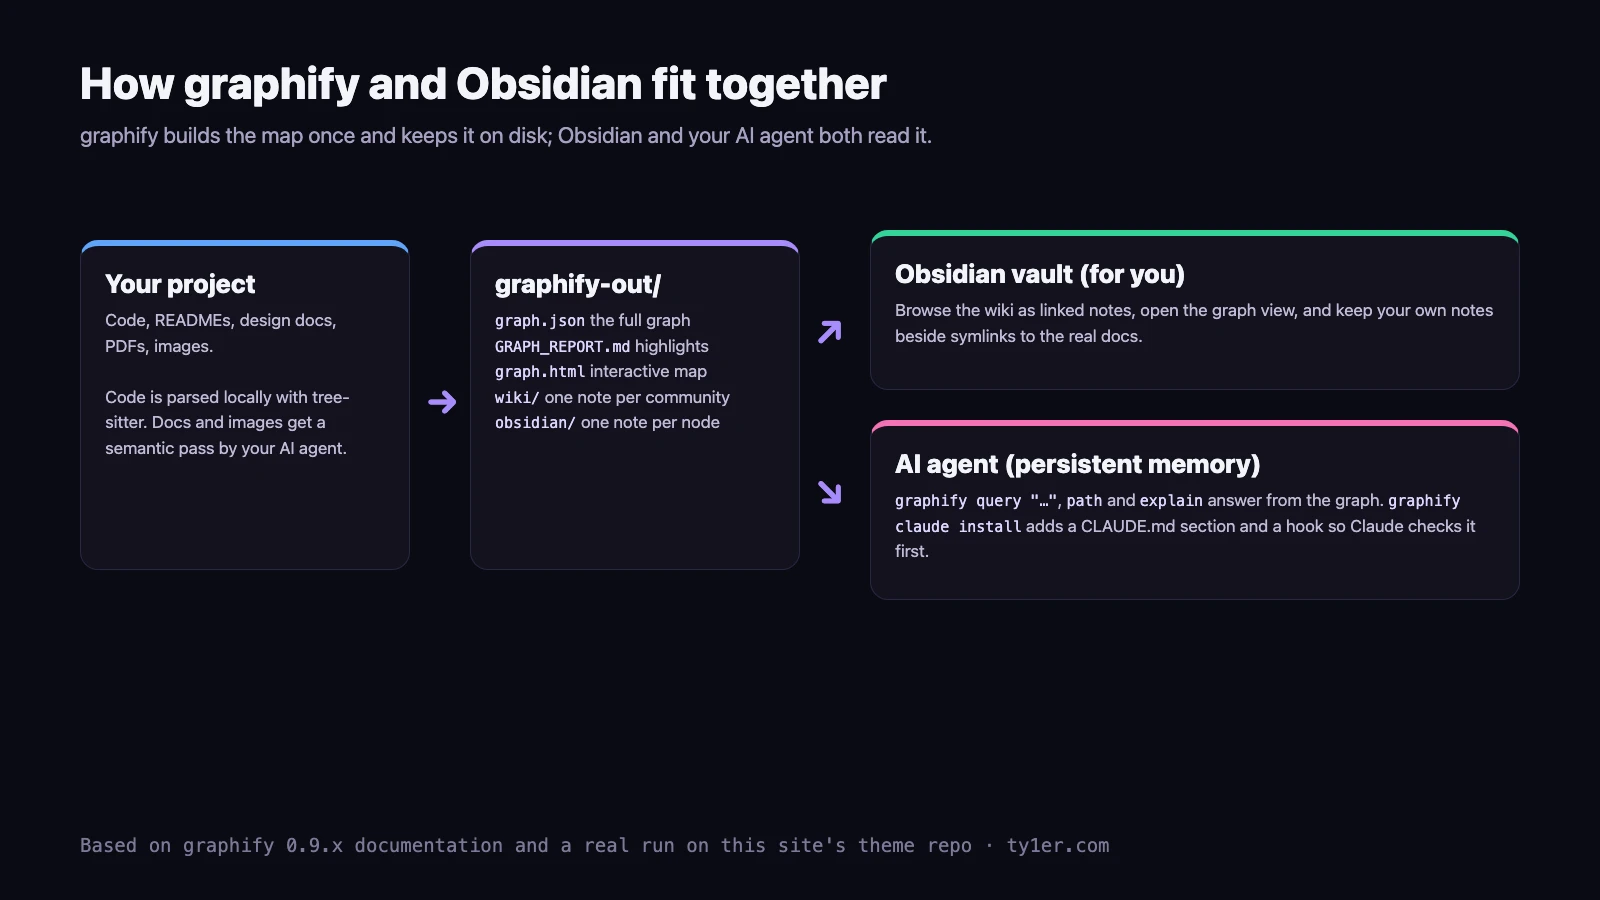
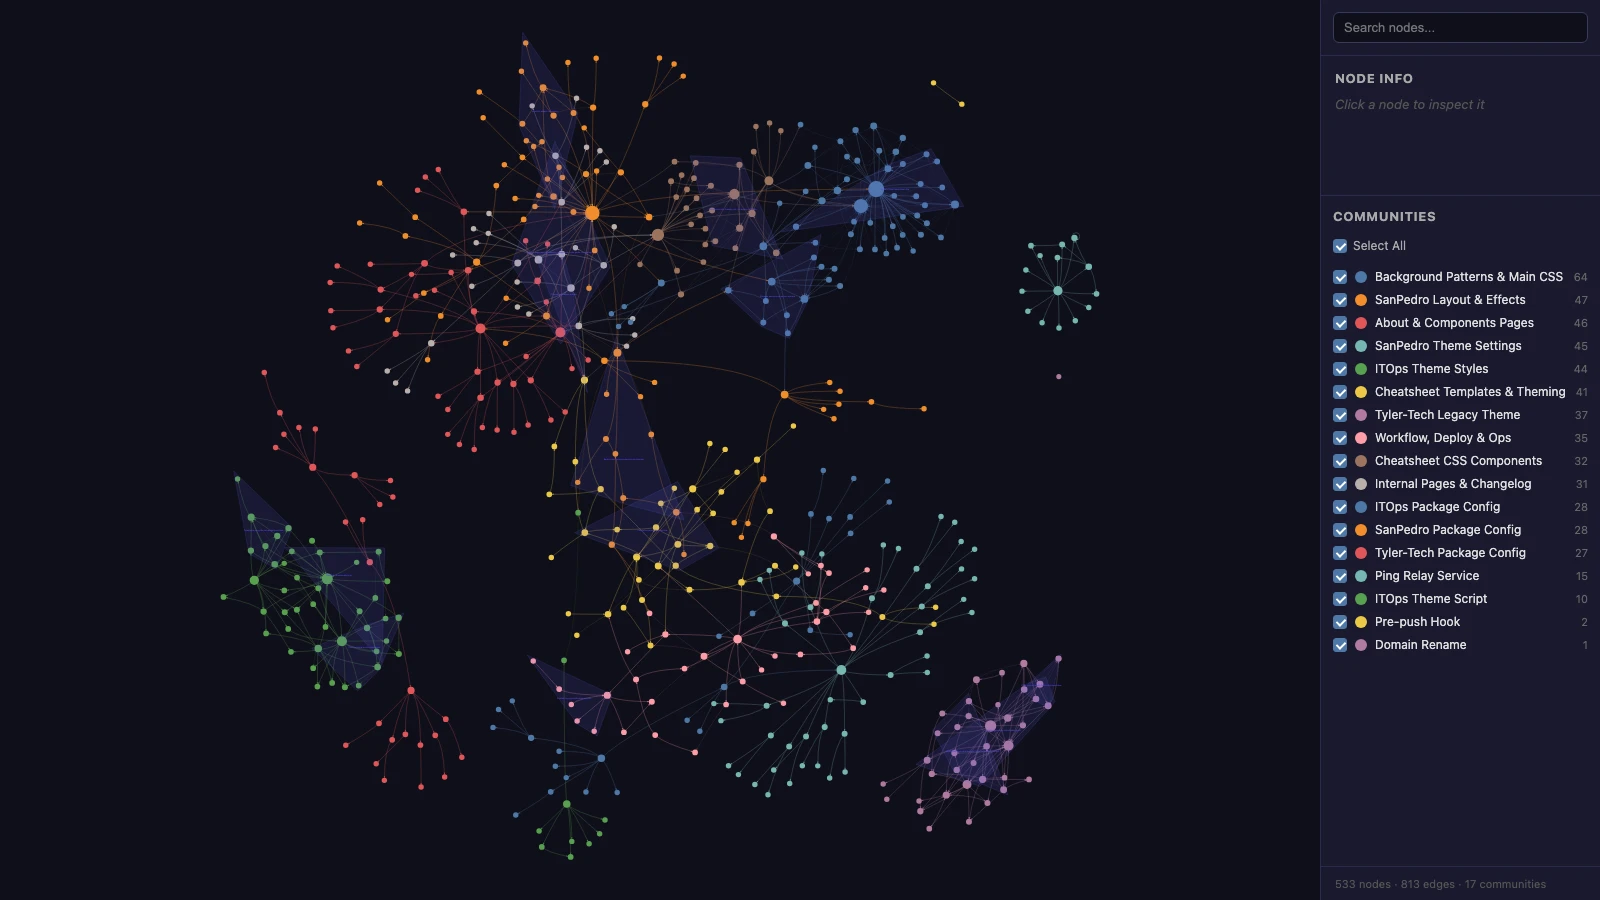
/graphify .graphify detects your files, parses the code, sends docs and images to your assistant for the semantic pass, clusters the graph, and writes everything to a graphify-out/ folder:
graph.html: an interactive map you can open in any browser, with search and per-community filters.GRAPH_REPORT.md: the highlights, covering god nodes, surprising connections, and suggested questions.graph.json: the full graph, which you can query anytime without rereading your files.
No API key is required. Code is parsed locally, and your assistant does the semantic pass itself. The semantic pass does cost tokens, though, so expect a bigger bill for doc-heavy projects.
Step 4: Open it in Obsidian
graphify can turn the graph into Markdown in two ways, and both open in Obsidian:
- A wiki (
/graphify . --wiki, orgraphify export wikion an existing graph) writesgraphify-out/wiki/: an index plus one article per community and per key concept, linked together. It's compact and readable, and it's what I use. - A full vault (
/graphify . --obsidian, orgraphify export obsidian --dir ~/vaults/my-project) writes one note per node. That's great for the graph view, but it can mean hundreds or thousands of small files.
The simplest option: in Obsidian, choose Open folder as vault and pick the exported folder. Then press Cmd+G (Ctrl+G on Windows and Linux) for the graph view.
A better layout: a project vault that stays in sync
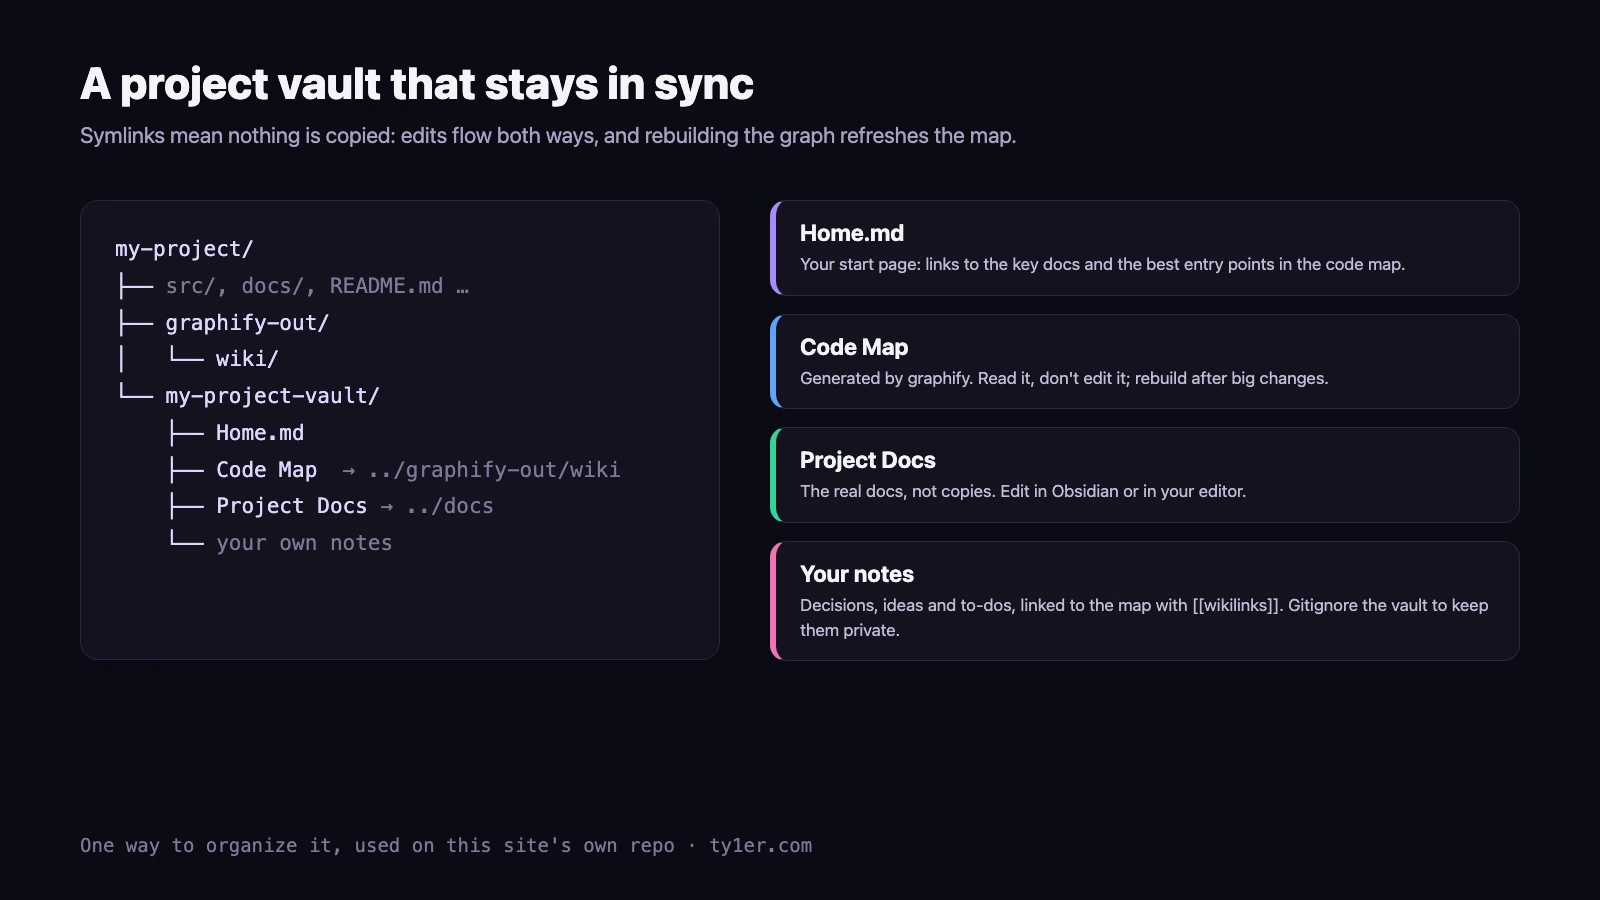
For a project you work on every day, I like a small vault next to the code that links to the real files instead of copying them:
cd my-project
mkdir my-project-vault
ln -s ../graphify-out/wiki "my-project-vault/Code Map"
ln -s ../docs "my-project-vault/Project Docs"
echo "/my-project-vault/" >> .gitignore
Add a Home.md with links to your key docs and the best entry points in the code map, then open my-project-vault as a vault. Now the Code Map refreshes whenever graphify rebuilds, the Project Docs are the real files (edit them in Obsidian or your editor, either way), and your own notes live alongside both. On Windows, use mklink /D instead of ln -s.
Two cautions: never link a folder inside itself, which creates a loop, and keep the vault in .gitignore unless you mean to share your personal notes.
How it helps visually
- See the shape of the project. Communities show up as colored clusters, so you can see at a glance which parts are self-contained and which are tangled together.
- Find the load-bearing pieces. God nodes are the things everything flows through. On my theme repo, the top one was the color-token system with 31 connections. That's the code to change most carefully.
- Spot surprises. The report lists connections you might not expect. Mine found that the 16 custom settings described in one doc match the theme's
package.jsonconfig, and that the per-brand cheatsheet colors work like the background-pattern system. - Navigate like a wiki. In Obsidian, every community note links to the communities it touches, and backlinks show what points to a note. Onboarding becomes clicking around rather than reading every file.
How it gives your project better memory
The graph is the memory: it lives in graphify-out/graph.json and survives between sessions. Instead of rediscovering the codebase, your agent (or you) can ask it questions directly:
graphify query "what connects the cheatsheet theme to the page templates?"
graphify path "header" "theme settings"
graphify explain "post TOC"
To make your assistant use it automatically, run this once per project:
graphify claude installFor Claude Code, this adds a ## graphify section to your project's CLAUDE.md telling Claude to check the graph before answering codebase questions. It also installs a hook that nudges Claude toward graphify query before it starts searching or reading files one by one. Other assistants get the same guidance through files like AGENTS.md or .cursor/rules/.
Keep the memory fresh:
graphify update .          # re-extract changed code, no AI tokens needed
/graphify . --update       # also re-read changed docs and images
graphify hook install      # rebuild automatically after each git commit
Obsidian adds the human half of memory: decisions, ideas, and to-dos written as notes and linked to the parts of the map they're about. Over time, the vault becomes the place where why things are the way they are actually gets written down.
What I found in practice
On this site's Ghost theme repo (about 80 files), the run produced 533 nodes, 813 connections, and 17 communities. A few honest lessons:
- Check language support. graphify didn't recognize Handlebars templates or CSS, which is most of a Ghost theme. I had to pass those files in as documents so the semantic pass could read them. Links found that way are inferred rather than parsed, so they're less certain.
- Skip what doesn't add meaning. The repo had 93 small icon images. Each image needs its own vision pass, so I excluded them.
- Budget for the semantic pass. Reading 73 templates, stylesheets, and docs took about 444,000 tokens across five parallel subagents. Code-only projects are much cheaper, because parsing code is free.
- Small projects benefit less. For a repo this size, an agent can often just search the files. The payoff grows with bigger projects, more docs, and more sessions.
- Check the output for secrets. I searched the generated notes for emails, IP addresses, and keys before linking them into a vault. Nothing turned up, but it's a habit worth keeping.
graphify's own benchmarks are encouraging. On a cross-tool test, the project reports 82.0% key-fact coverage, compared with 70.8% for a grep-and-read baseline. Treat that as the project's claim, and measure on your own code.
Quick tips
- Run
/graphify --helpfor every option, including--mode deepfor richer inferred links and--directedfor one-way edges. - Huge repos can produce thousands of nodes. Graph a subfolder first, or let the HTML view switch to its community overview.
- Add
graphify-out/to.gitignoreif you don't want the graph in version control, or commit it on purpose so your team shares the same map. - To remove everything:
graphify uninstall(add--purgeto deletegraphify-out/too).
Links
- graphify on GitHub and the graphify docs, including installation and troubleshooting.
- Download Obsidian and Obsidian Help.
- uv, the recommended Python tool installer.
Working with Claude Code? See also Claude Code and the iOS Simulator on macOS and REA: Reverse Engineer Anything.